Report and Charts
Manage the project and access information about the project in the Predict Dashboard. Open your project and click Dashboard to view overall project statistics. Information is available on each of the tabs:

The information at the Review Statistics tab includes:
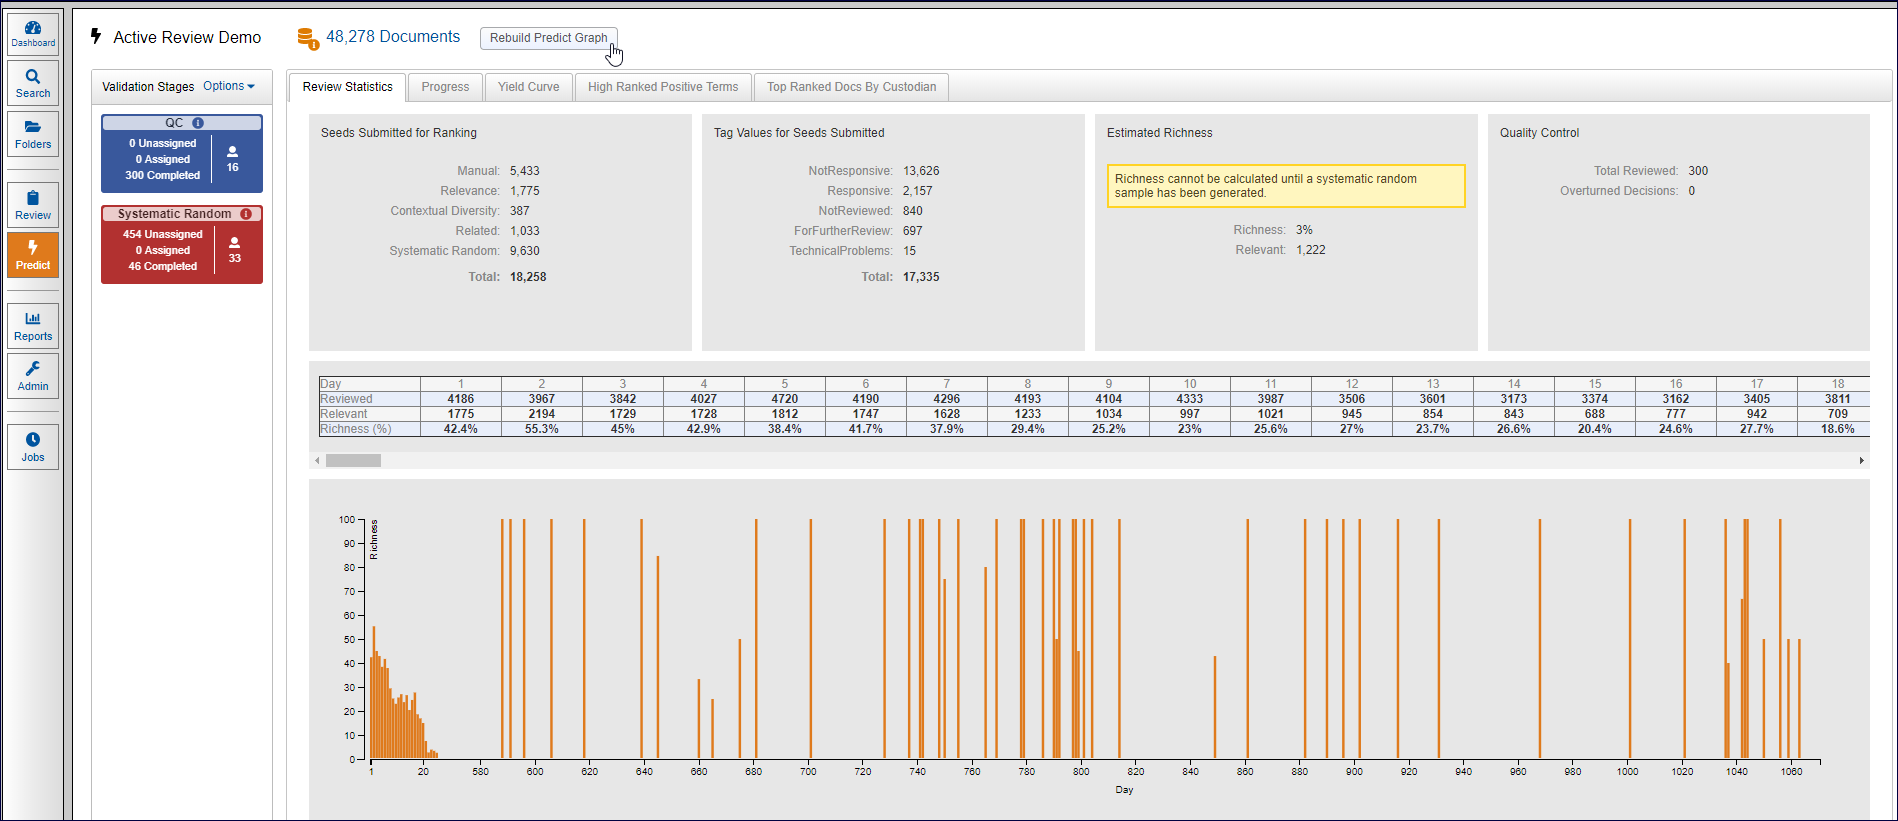
Seeds Submitted for Ranking: This first section includes the documents (i.e. seeds) that have been sent to Predict so that Predict is trained on what is relevant and not-relevant.
Manual: The number of documents submitted to Predict from outside the ranked list.
Relevance: The number of reviewed documents assigned to reviewers from the ranked list.
Contextual Diversity: The total number of reviewed seeds assigned by Predict using Contextual Diversity to find unknown pockets of documents.
Related: The reviewed seeds not assigned by Predict but reviewed because they were related to the documents assigned by Predict.
Systematic Random: The number of documents reviewed after having been selected in the Systematic Random stage of Predict.
Tag Values for Seeds Submitted: The possible values in the Decision field and the number of documents tagged with each value.
Estimated Richness: The number of documents in the collection likely to be relevant. This number is based on the Confidence Level and Margin of Error established after running the Richness Estimate in the Systematic Random stage. In this example, the system estimates that.
Approximately 23,540 documents, (22% of the collection containing 107,000 documents), are relevant.
With a margin of error of plus or minus 5%, these 23,540 documents will appear in a range between 22,363 (95%) to 24,717 (105%).
Quality Control: The total number of documents reviewed in the QC stage, and the number of decisions that were overturned.
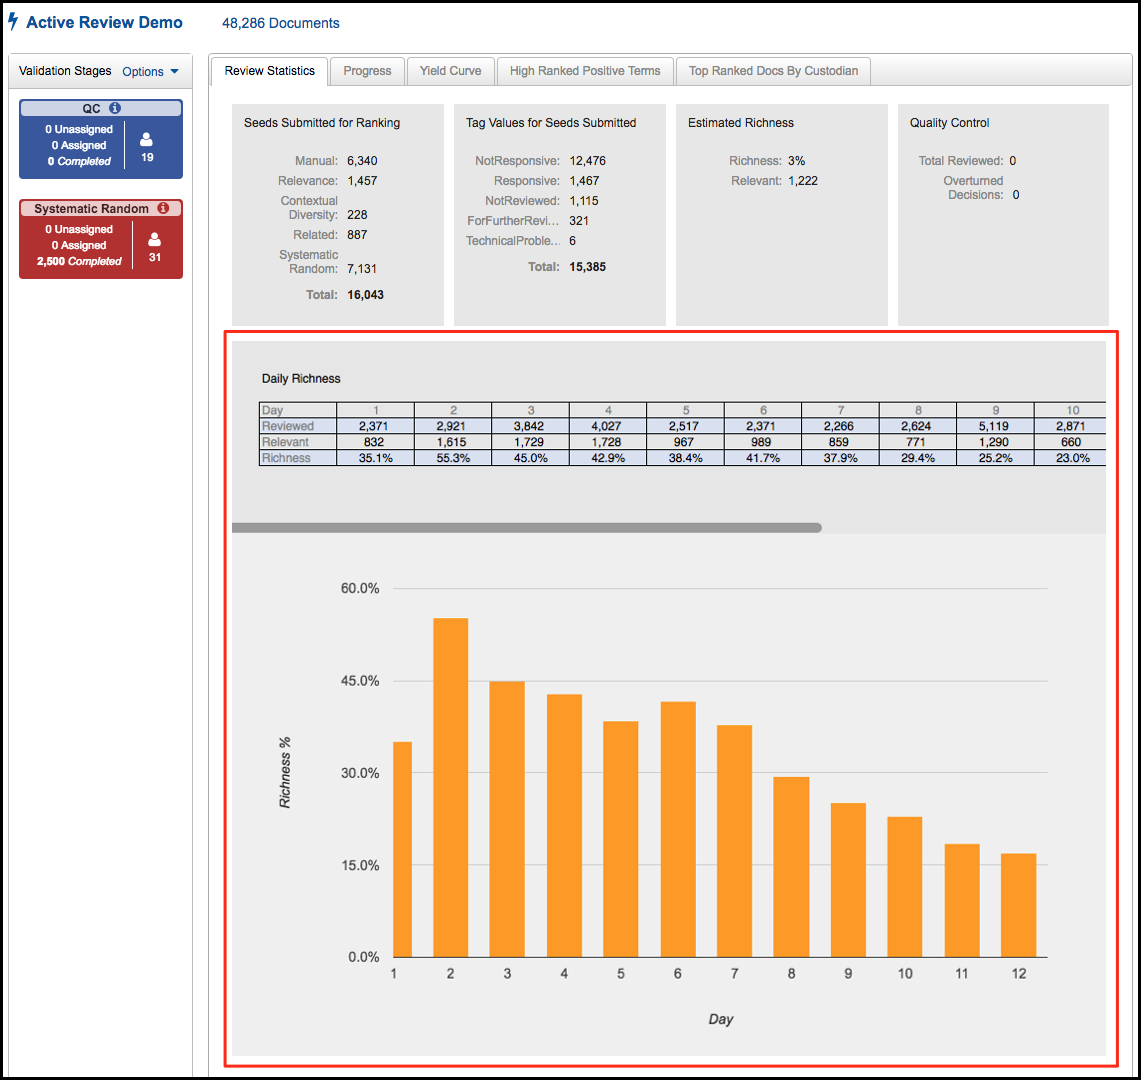
Daily Richness
This report is used to help review managers manage their review teams and know when to stop the review based on the richness observation. The richness is calculated on a daily basis so the manager can compare current richness against the historical high-water mark.
As Predict feeds the most likely relevant documents to the review team first, the richness percentage will be high because the reviewers are reviewing mostly relevant documents. As the project progresses, the manager will notice the richness percentage will start to decrease because the reviewers are running out of relevant documents. This chart helps them follow the pattern and make educated decisions on when to stop a review.
The calculation table shows the number of documents reviewed, how many are relevant and the calculated richness. This is shown for each day of the review.
Below the table is the bar chart, which is an illustration of the increasing and decreasing richness percentage per day.

High Ranked Positive Terms Tab
Click the High Ranked Positive Terms tab to review a list of the top 10,000 highest-ranked terms in the document collection. This list can be useful when you are looking for key words in your data. Notice that the terms might change dramatically when you compare earlier rankings to later ones, especially if new types of documents are introduced into the collection and ranked.
Top Ranked Docs by Custodian Tab
Click the Top Ranked Docs By Custodian tab to display this chart, which shows the custodians with the most highly ranked documents.